
Research briefs
Restaurant Costs and Margins in Canada: Where the Money Goes
4.1%was the 2024 operating profit margin of Canadian food services and drinking places in Statistics Canada data, and Restaurants Canada's September 2026 Foodservice Facts gives the same figure as the industry's average pre tax margin.
By HBT AccountingSources checked 6 min read
Key points
- Statistics Canada puts the 2024 operating profit margin of food services and drinking places at 4.1% on $99.6 billion of revenue
- Cost of goods sold takes 35.9% of operating expenses and pay and benefits 33.6%, together 69.5%
- Restaurants Canada says 41% of restaurant companies are at a loss or breaking even, up from 12% in 2019
- Mandatory service charges carry GST/HST and payroll deductions, while freely given tips handed straight to staff do not
Where each dollar of expense goes
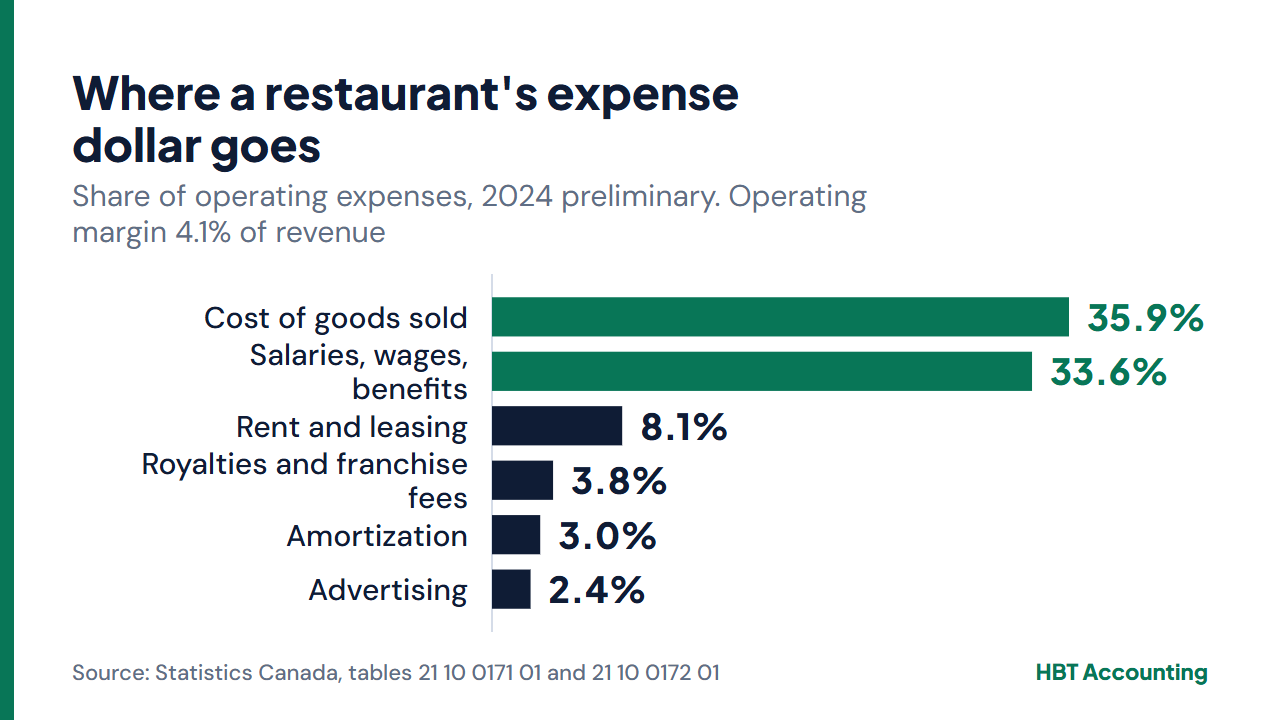
The most detailed public breakdown of restaurant costs comes from Statistics Canada's annual survey of food services and drinking places. For 2024, the latest year and a preliminary one, it shows operating revenue of $99.6 billion and operating expenses of $95.5 billion, which leaves an operating profit margin of 4.1%. Of every dollar of operating expense, 35.9 cents went to cost of goods sold. Another 33.6 cents went to salaries, wages, commissions and benefits. Rental and leasing took 8.1 cents, royalties, franchise fees and memberships 3.8 cents and amortization and depreciation 3.0 cents.
These shares are of operating expenses, not of sales. Expenses were 95.9% of revenue in 2024, so each share is slightly smaller measured against sales. As an illustration worked from the same tables, take $100 of sales. A typical operator spent about $34.40 on cost of goods sold, $32.20 on pay and benefits and $7.80 on rent and leasing. That left an operating profit of about $4.10.
| Cost line | All food services | Full service restaurants | Limited service eating places |
|---|---|---|---|
| Cost of goods sold | 35.9% | 35.2% | 36.6% |
| Salaries, wages, commissions and benefits | 33.6% | 35.0% | 31.4% |
| Rental and leasing | 8.1% | 8.4% | 8.5% |
| Royalties, franchise fees and memberships | 3.8% | 2.3% | 5.7% |
| Amortization and depreciation | 3.0% | 2.8% | 3.3% |
| Advertising, marketing, promotions, meals and entertainment | 2.4% | 1.9% | 3.1% |
| Repair and maintenance | 2.0% | 2.2% | 1.8% |
| Utilities | 1.9% | 2.2% | 1.8% |
| Professional and business fees | 1.3% | 1.6% | 1.2% |
| Financial services | 1.2% | 1.5% | 0.9% |
| Insurance | 0.7% | 0.8% | 0.6% |
Formats and the trend since 2019
Full service restaurants spent 35.0% of operating expenses on pay in 2024, against 31.4% at limited service eating places. Limited service places spent 5.7% on royalties, franchise fees and memberships, against 2.3% at full service restaurants. Margins moved in opposite directions after 2019. Full service restaurants went from 3.0% to 3.9%, while limited service places slipped from 4.3% to 3.7%.
Across the whole sector the margin peaked at 6.2% in 2021 and was 4.1% in 2024. The cost mix was steadier. Cost of goods sold was 35.9% of operating expenses in both 2019 and 2024. The pay share was 33.2% in 2019, 32.6% in 2021 and 33.6% in 2024. Royalties, franchise fees and memberships rose from 2.9% to 3.8% over the period, while rental and leasing slipped from 8.7% to 8.1%. Alcohol sold for drinking on the premises made up 11.0% of total sales in 2024, food and non alcoholic drinks 86.5% and other sales 2.5%. In dollar terms, limited service places had $44.9 billion of operating revenue in 2024 and full service restaurants $44.2 billion.
| Year | All food services | Full service restaurants | Limited service eating places |
|---|---|---|---|
| 2019 | 3.8% | 3.0% | 4.3% |
| 2020 | 4.0% | 2.5% | 5.6% |
| 2021 | 6.2% | 5.7% | 7.1% |
| 2022 | 4.2% | 4.1% | 4.0% |
| 2023 | 3.6% | 3.5% | 3.2% |
| 2024 | 4.1% | 3.9% | 3.7% |
Differences by province
Statistics Canada publishes the same lines by province. In 2024 the operating profit margin was 3.1% in Ontario and 4.0% in Quebec, against 5.1% in British Columbia, 5.2% in Alberta and 5.5% in both Manitoba and Saskatchewan. Pay took 35.9% of operating expenses in British Columbia and 35.2% in Quebec, but 32.3% in Alberta, 32.4% in Ontario and 31.7% in Saskatchewan.
Rental and leasing took 8.8% in Alberta and 8.5% in Ontario, against 7.4% in Quebec and Saskatchewan. Among these six provinces, cost of goods sold ran from 34.5% in British Columbia to 37.4% in Saskatchewan. The tables do not explain the gaps. An operator comparing its own statements with these averages should express each line as a share of total operating expenses first, because the published shares use that base and not sales.
| Province | Operating profit margin | Pay and benefits | Rental and leasing | Cost of goods sold |
|---|---|---|---|---|
| Ontario | 3.1% | 32.4% | 8.5% | 36.5% |
| Quebec | 4.0% | 35.2% | 7.4% | 35.9% |
| British Columbia | 5.1% | 35.9% | 8.4% | 34.5% |
| Alberta | 5.2% | 32.3% | 8.8% | 35.2% |
| Manitoba | 5.5% | 34.2% | 7.7% | 34.9% |
| Saskatchewan | 5.5% | 31.7% | 7.4% | 37.4% |
What Restaurants Canada and CFIB report
Restaurants Canada's Foodservice Facts 2026, released in September 2026, projects sales of nearly $130 billion for 2026 and puts the average industry pre tax profit margin at 4.1%. It says 41% of restaurant companies are operating at a loss or just breaking even, up from 12% in 2019. A February 2026 release from the same group put the share at 44% as of November 2025, so the figure moves from survey to survey. The industry employs 1.2 million workers and buys $43 billion of food and beverage products a year, 68% of it from Canadian suppliers.
In its fourth quarter 2025 report, released in February 2026, Restaurants Canada said 88% of operators named food costs a top concern, up from 83% in June 2025. It said 89% named labour costs, up from 80%. The release does not state the survey's sample size or fieldwork dates.
The Canadian Federation of Independent Business said in October 2026 that Visa plans to join Mastercard in charging a new fee of 1.95 cents in US dollars on all domestic transactions. Mastercard is applying it now and Visa plans to start in April 2027. The fee applies to each transaction, so its weight depends on how many card payments a restaurant takes.
Tips, service charges and payroll
The CRA separates controlled tips from direct tips. Controlled tips are those the employer controls or holds before paying out, such as mandatory service charges and tip pools set up by the employer. The employer withholds income tax, EI premiums and CPP contributions on them and reports them in boxes 14, 24 and 26 of the T4. Direct tips go from the customer to the employee with no employer control. Nothing is withheld, the employee may choose to pay CPP on them with Form CPT20, and any tips not on a T4 are reported on line 10400 of the employee's return. Quebec has its own rule for declared tips.
For GST/HST, the CRA says a tip freely given by a customer, such as cash not recorded on a bill, is not subject to GST/HST. A mandatory amount added to the bill as a service charge is different, and GST/HST must be charged on it. As an illustration, a restaurant adds an 18% service charge to a $1,000 party bill. The $180 is a mandatory amount, so GST/HST applies to $1,180, and paying the $180 to staff is payroll with deductions.
Quick answers
What is a typical profit margin for a restaurant in Canada?
Statistics Canada reports a 2024 operating profit margin of 4.1% for food services and drinking places, 3.9% for full service restaurants and 3.7% for limited service places. Restaurants Canada gives an average pre tax margin of 4.1% in Foodservice Facts 2026.
What is a normal food cost percentage for a restaurant in Canada?
Statistics Canada does not publish food cost alone. Its closest line, cost of goods sold, was 35.9% of operating expenses in 2024, about 34.4% of revenue once the 4.1% margin is allowed for. It is an industry average, and individual restaurants vary with menu and format.
How much of a restaurant's costs is labour?
Salaries, wages, commissions and benefits were 33.6% of operating expenses in 2024, or about 32.2% of operating revenue. Full service restaurants were higher at 35.0% of expenses.
Is GST/HST charged on tips?
Not on a tip freely given by a customer. A mandatory service charge added to the bill is taxable, so GST/HST must be charged on that amount.
Do restaurants deduct CPP and EI from tips?
From controlled tips, yes, such as mandatory service charges and employer set pools. Not from direct tips paid by the customer to the employee, although the employee may elect to pay CPP on them with Form CPT20.
Related pages
Official sources
- Statistics Canada: Table 21-10-0172-01, Food services and drinking places, industry expenditures
- Statistics Canada: Table 21-10-0171-01, Food services and drinking places, summary statistics
- Statistics Canada: Table 21-10-0213-01, Food services and drinking places, distribution of total sales
- Restaurants Canada: Eight in 10 Canadians are cutting back on restaurant visits as affordability pressures worsen
- Restaurants Canada: 2025 foodservice sales buffered by GST holiday as rising operating costs and tariffs cut into profits, Restaurants brace for more obstacles in 2026
- CRA: Tips received by employees
- CRA: GST/HST in special cases
- CFIB: Visa lowers interchange fees for tens of thousands of small businesses, but new credit card fees are on the horizon
Call or email and we will tell you which records we need and what the work costs, in writing, before anything starts.
Important. This article provides general educational information, not legal or tax advice for a specific business. Rules, administrative policies, rates and deadlines can change. Confirm your facts and current obligations with the responsible government agency and a qualified adviser.